Admissions of Under-represented Groups
Lebanese American University (LAU) systematically measures and tracks applications and admissions for underrepresented groups, including women. This data is collected and analyzed regularly to identify trends and inform strategies for promoting equality in higher education. For example, LAU’s Admissions by Gender - Fall 2023 report provides detailed metrics on applications, acceptance rates, and yield rates for female and male students across undergraduate, graduate, and professional levels. These insights help shape gender equality initiatives.
Additionally, LAU offers scholarships and grants that support underrepresented and underserved populations, including low-income students, refugees, and non-traditional students. Programs such as USAID scholarships, MEPI initiatives, and other financial aid grants and opportunities are tailored to increase access to higher education for marginalized groups. These initiatives demonstrate LAU’s commitment to inclusivity and equal opportunity by addressing socioeconomic disparities and fostering diversity in its student body.
Admissions by Gender - Fall 2023
| Level | Received | Accepted | Enrolled | Acceptance Rate | Yield Rate | |||||
|---|---|---|---|---|---|---|---|---|---|---|
| Female | Male | Female | Male | Female | Male | Female | Male | Female | Male | |
| Undergraduate | 3,952 | 3,229 | 2,560 | 2,143 | 1,104 | 1,016 | 64.8% | 66.4% | 43.1% | 47.4% |
| Graduate | 517 | 341 | 259 | 204 | 162 | 134 | 50.1% | 59.8% | 62.5% | 65.7% |
| Doctoral - Professional Practice | 151 | 103 | 99 | 62 | 59 | 33 | 65.6% | 60.2% | 59.6% | 53.2% |
| Total | 4,620 | 3,673 | 2,918 | 2,409 | 1,325 | 1,183 | 63.2% | 65.6% | 45.4% | 49.1% |
Admissions by Gender - Fall 2022
| Level |
Received Applications |
Accepted Applications |
Enrolled Applicants |
Acceptance Rate |
Yield rate |
|||||
|---|---|---|---|---|---|---|---|---|---|---|
| Gender | Female | Male | Female | Male | Female | Male | Female | Male | Female | Male |
| Undergraduate | 4394 | 3720 | 2782 | 2428 | 1104 | 987 | 63.3% | 65.3% | 39.7% | 40.7% |
| Graduate | 350 | 264 | 186 | 146 | 95 | 80 | 53.1% | 55.3% | 51.1% | 54.8% |
| Doctoral - Professional Practice | 285 | 179 | 102 | 56 | 68 | 29 | 35.8% | 31.3% | 66.7% | 51.8% |
| Total | 5029 | 4163 | 3070 | 2630 | 1,267 | 1096 | 61.0% | 63.2% | 41.3% | 41.7% |
Financial Aid and Scholarships
At LAU, we believe that all eligible students deserve an excellent education, regardless of financial limitations, nationality, race, gender, religion or ethnicity. Together, scholarships and financial aid packages can cover up to 100% of your LAU tuition.
We encourage you to apply for financial aid and scholarships as early as possible.
USAID Higher Education Scholarship Program
USAID provides merit-based scholarships to financially needy and academically eligible public school graduates from across Lebanon, including the most disadvantaged corners of the country. These scholarships enable students, often from marginalized families that would otherwise have no possible means to attend these schools, to study at the highest-quality Lebanese universities. These universities offer an American-style education that promotes critical thinking, leadership skills and community service.
Our impacts in this sector include:
A higher education scholarship program that provides full, four-year scholarships to more than 600 Lebanese public school graduates. Although the program targets men and women equally, the gender breakdown represents the prevailing one in the public school system; nearly two-thirds of the recipients are women.
Grants awarded through the National Academies of Science to five Lebanese scientists from prominent Lebanese universities to complete specialized research on water and air pollution, wildfires and landslides. The grants promote direct cooperation with American scientists and access to cutting-edge research as part of the Washington-based Partnership for Enhanced Engagement in Research (PEER).
In a Nutshell
|
$100 Million+ |
600+ |
|
70%+ |
300+ students |
|
2,100+ |
165+ students |
|
1,500+ |
123 |
LEBANESE AMERICAN UNIVERSITY STUDENT CODE OF CONDUCT
Article I: Introduction
The Lebanese American University (LAU) Student Code of Conduct emanates from the institutional values, mission, and vision of a university committed to Student centeredness, the education of the whole person, the enhancement of Student leadership, the promotion of the highest ethical and moral values and aspirations, the safeguarding of academic integrity, the development of a deep sense of civic engagement, and the advancement of peace, democracy, and social justice.
In the context of a university operating as an extended family community, the Student Code of Conduct regulates the pedagogical and behavioral relationship between administration, faculty, staff, and Students. It describes the boundaries of acceptable Student behavior and considers the individual Student’s welfare as inseparable from the welfare of the University community. The Student Code of Conduct works in tandem with the Schools’ bylaws which address school-specific issues and concerns. While Students have the privilege to enroll at the institution of their choice, choosing to enroll at LAU requires them to become aware of and abide by the behavioral standards of the University.
The University respects the dignity of all individuals and in return expects each individual to have that same respect for others within the University community, so that all may achieve their full potential. Membership in the LAU community imparts to every Student a set of rights and responsibilities that are essential to the University’s educational mission. LAU Students enjoy the rights to freedom of thought and expression; freedom from discrimination on the basis of race, ethnicity, religion, national origin, gender, age, disability, or family status; participation in the academic and non-academic opportunities offered by the University; and fair judicial process in the determination of accountability for conduct. In return, Students are expected to exhibit responsible behavior that complies with all provisions of the Student Code of Conduct and abstain from harming or threatening to harm any individual or group. The University will take appropriate disciplinary action in situations involving misconduct or demonstrating flagrant disregard for any person or property.
Disciplining Students is part of the learning process and, as such, its focus shall be educational for the individual and for the University community. This includes the possible use of suspension or expulsion and/or other penalties or remedies. Any query about the processes, rules, or policies, or any other concern not specifically covered by the Student Code of Conduct shall be decided by the University Student Affairs Council. Additionally, the Student Code of Conduct may be extended or amended to apply to new and unanticipated situations. Enrollment in the University does not protect Students from their obligation to behave in a manner consistent with Lebanese law.
Article II: Student Rights and Expectations
1.In General
Within the framework of the LAU Bylaws and applicable policies and procedures, including those pertaining to standards of conduct, LAU shall endeavor to provide a campus and institutional environment in which:
1.1. The opportunity for free inquiry, expression, and creed is protected;
1.2. Discrimination and harassment based on race, sex, age, color, national origin, religion, or disability are not tolerated;
1.3. Students are provided with shelter and security;
1.4. Student records are protected from improper disclosure; and
1.5. Opportunities are provided for Student engagement in the governance of the University through membership in appropriately designated councils and committees, provided such councils and committees meet requirements established by the University.
2. Academic Rights
LAU shall endeavor to ensure that Students are provided:
2.1. Clearly enunciated University expectations regarding academic integrity, policies, procedures, and sanctions pertaining to relevant violations;
2.2. Information by the faculty about course requirements (including amended requirements), evaluation procedures, and the academic criteria to be used in each course; and
2.3. Impartial evaluations on the basis of academic performance.
Article III: Proscribed Conduct
- Jurisdiction of the University
The University exercises its jurisdiction over Student conduct that takes place on University Premises and at any University Sponsored Function. The University reserves the right to extend its jurisdiction to off-campus occurrences elsewhere when a Student’s behavior either negatively impacts the integrity or reputation of the University or threatens the health, safety, or property of any individual or group.
2. Conduct Rules and Regulations
LAU Students are expected to respect, abide by, and comply with the letter and the spirit of the University’s Student Code of Conduct on and off campus. Any Student found to have committed misconduct is subject to the disciplinary sanctions outlined in Appendices A and B of this Student Code of Conduct.
2.1. Non-Academic Violations. The following proscribed activities are characterized as non-academic violations:
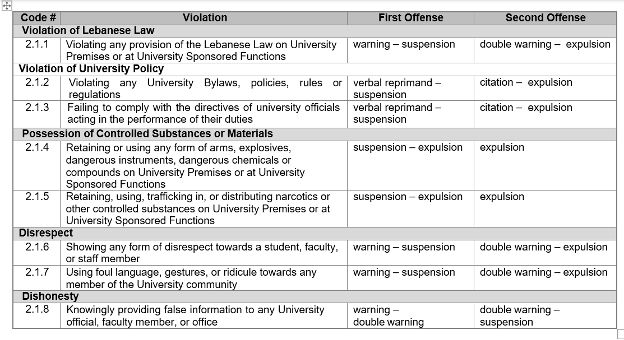
Violation of Lebanese Law
2.1.1. Violating any provision of the Lebanese law on University Premises or at University Sponsored Functions
Violation of University Policy
2.1.2. Violating any University Bylaws, policies, rules or regulations.
2.1.3. Failing to comply with the directives of University officials acting in performance of their duties.
Possession of Controlled Substances or Materials
2.1.4. Retaining or using any form of arms, explosives, dangerous instruments, dangerous chemicals or compounds on University Premises or at University Sponsored Functions.
2.1.5. Retaining, using, trafficking in, or distributing narcotics or other controlled substances on University Premises or at University Sponsored Functions.
Disrespect
2.1.6. Showing any form of disrespect towards a Student, faculty, or staff member.
2.1.7. Using foul language, gestures or ridicule towards any member of the University community.
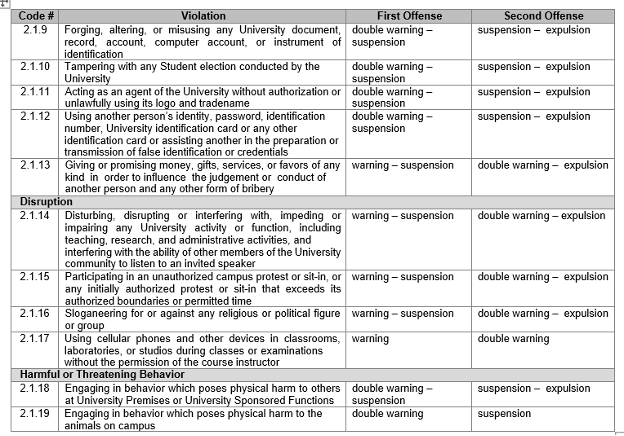
Dishonesty
2.1.8. Knowingly providing false information to any University official, faculty member, or office.
2.1.9. Forging, altering, or misusing any University document, record, account, computer account, or instrument of identification.
2.1.10. Tampering with any Student election conducted by the University.
2.1.11. Acting as an agent of the University without authorization or unlawfully using its logo and tradename.
2.1.12. Using another person’s identity, password, identification number, University identification card or any other identification card, or assisting another in the preparation or transmission of false identification or credentials.
2.1.13. Giving or promising money, gifts, services or favors of any kind, in order to influence the judgment or conduct of another person and any other form of bribery.
Disruption
2.1.14. Disturbing, disrupting or interfering with, impeding or impairing any University activity or function, including teaching, research, and administrative activities, and interfering with the ability of other members of the University community to listen to an invited speaker.
2.1.15. Participating in an unauthorized campus protest or sit-in, or any initially authorized protest or sit-in that exceeds its authorized boundaries or permitted time.
2.1.16. Sloganeering for or against any religious or political figure or group.
2.1.17. Using cellular phones and other devices in classrooms, laboratories, or studios during classes or examinations without the permission of the course instructor.
Harmful or Threatening Behavior
2.1.18. Engaging in behavior which poses physical harm to others at University Premises or University Sponsored Functions.
2.1.19. Engaging in behavior which poses physical harm to the animals on campus.
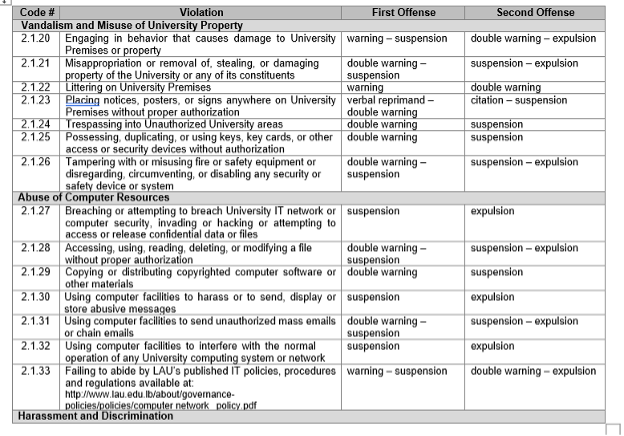
Vandalism and Misuse of University Property
2.1.20. Engaging in behavior that causes damage to University Premises or property.
2.1.21. Misappropriation or removal of, stealing, or damaging property of the University or any of its constituents.
2.1.22. Littering on University Premises.
2.1.23. Placing notices, posters, or signs anywhere on University Premises without proper authorization.
2.1.24. Trespassing into unauthorized University areas.
2.1.25. Possessing, duplicating, or using keys, key cards, or other access or security devices without authorization.
2.1.26. Tampering with or misusing fire or safety equipment or disregarding, circumventing, or disabling any security or safety device or system.
Abuse of Computer Resources
2.1.27. Breaching or attempting to breach University IT network or computer security, invading or hacking or attempting to access or release confidential data or files.
2.1.28. Accessing, using, reading, deleting, or modifying a file without proper authorization.
2.1.29. Copying or distributing copyrighted computer software or other materials.
2.1.30. Using computer facilities to harass or to send, display or store abusive messages.
2.1.31. Using computer facilities to send unauthorized mass emails or chain emails.
2.1.32. Using computer facilities to interfere with the normal operation of any University computing system or network.
2.1.33. Failing to abide by LAU’s published IT policies, procedures and regulations, available at:
http://www.lau.edu.lb/about/governance-policies/policies/computer_network_policy.pdf
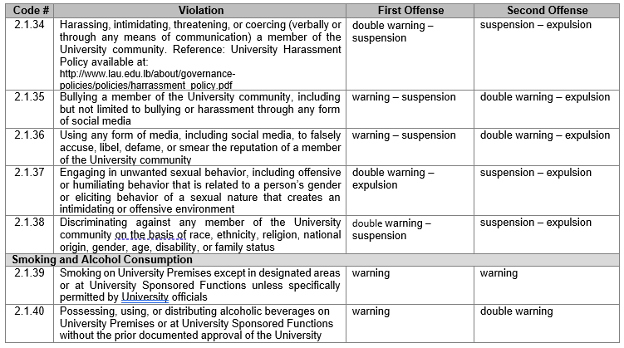
Harassment and Discrimination
2.1.34. Harassing, intimidating, threatening, or coercing (verbally or through any means of communication) a member of the University community. Reference: University Harassment Policy, available at:
http://www.lau.edu.lb/about/governance-policies/policies/harassment_policy.pdf
2.1.35. Bullying a member of the University community, including but not limited to bullying or harassment through any form of social media.
2.1.36. Using any form of media, including social media, to falsely accuse, libel, defame, or smear the reputation of a member of the University community.
2.1.37. Engaging in unwanted sexual behavior, including offensive or humiliating behavior that is related to a person’s gender or eliciting behavior of a sexual nature that creates an intimidating or offensive environment.
2.1.38. Discriminating against any member of the University community on the basis of race, ethnicity, religion, national origin, gender, age, disability, or family status.
Smoking and Alcohol Consumption
2.1.39. Smoking on University Premises except in designated areas or at University Sponsored Functions, unless specifically permitted by university officials.
2.1.40. Possessing, using, or distributing alcoholic beverages on University Premises or at University Sponsored Functions without the prior documented approval of the University.
2.2. Academic Integrity
Academic Integrity violations include all forms of academic dishonesty. The list, however, is not exhaustive; instructors and faculty members or University staff may report other cases as academic violations for investigation. The following proscribed activities are characterized as academic violations:
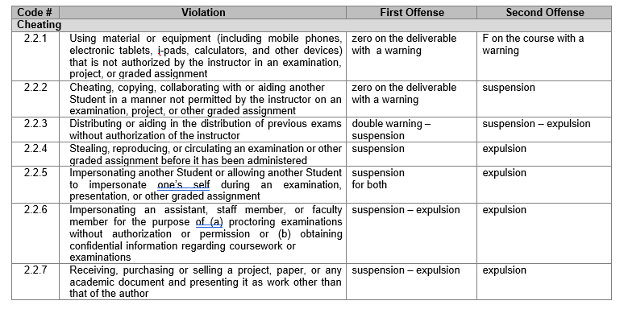
Cheating
2.2.1. Using material or equipment (including mobile phones, electronic tablets, i-pads, calculators, and other devices) that is not authorized by the instructor in an examination, project, or graded assignment.
2.2.2. Cheating, copying, collaborating with, or aiding another Student in a manner not permitted by the instructor on an examination, project, or other graded assignment.
2.2.3. Distributing or aiding in the distribution of previous exams without authorization of the instructor.
2.2.4. Stealing, reproducing, or circulating an examination or other graded assignment before it has been administered.
2.2.5. Impersonating another Student or allowing another Student to impersonate one’s self during an examination, presentation, or other graded assignment.
2.2.6. Impersonating an assistant, staff member or faculty member for the purpose of (a) proctoring examinations without proper authorization or permission or (b) obtaining confidential information regarding coursework or examinations.
2.2.7. Receiving, purchasing or selling a project, paper, or any academic document and presenting it as work other than that of the author.
2.2.8. Submitting identical papers or coursework for credit in more than one class without the permission of the instructor.
Plagiarism and Copyright Violations
2.2.9. Failing to attribute language or ideas to their original source by not crediting the original author with an appropriate acknowledgment or citation.
2.2.10. Using photocopied or electronic copies of textbooks, compact disks, films, music, online course materials and other content beyond the fair use policy within University Premises.
2.2.11. Using copyrighted materials, including in written research reports and papers, without obtaining required permission, if any, from the rights holder.
Unauthorized Sale, Distribution, or Use of Course Materials
2.2.12. Recording any lecture or presentation for personal use or public distribution without the prior consent of the course instructor. This applies to the unauthorized use of any medium including but not limited to mobile phones, electronic tablets, i-pads, recorders, films, and other devices.
2.2.13. Selling academic materials by any Student, club, or group. This includes but is not limited to lectures, course recordings, class notes, and previous exams.
3. Violation of the Student Code of Conduct and Lebanese Laws
University disciplinary proceedings will be instituted against any Student charged with a violation of this Student Code of Conduct. When governmental authorities charge a Student with any violation of the Lebanese laws, the University will not request or agree to special consideration for that individual because of his or her status as a Student.
Article IV: Disciplinary Proceedings
All members of the University community, including all Students, have a responsibility to cooperate fully and truthfully with the Dean of Students, University Student Affairs Council,
Appeals Committee, any Ad Hoc Disciplinary Committee and other University officials in connection with investigations of disciplinary complaints and related proceedings including appeal proceedings.
1. Reporting and Decision Procedure
1.1. Non-Academic Violations
Step 1: Report suspected misconduct. Any member of the University community may report alleged violations found in the “Non-Academic Violations” section of the Student Code of Conduct. A written complaint normally must be sent to the Dean of Students’ Office no later than seven (7) days after the occurrence. For incidents of harassment, a complaint must be submitted to the University Legal Counsel’s Office, as per the University Harassment Policy available at:
http://www.lau.edu.lb/about/governance-policies/policies/harassment_policy.pdf
In the case of sexual harassment incidents, and because of the severity and sensitivity of such cases, there is no set time frame for which incidents must be reported under. However, Students are encouraged in this case to report the incident as soon as possible to the University Legal Counsel, as per the University Harassment Policy.
Step 2: Process the complaint. All claims will be processed by the Dean of Students’ Office unless otherwise provided for in this Student Code of Conduct and applicable University policies. The Dean of Students and/or the Ad Hoc Disciplinary Committee shall gather pertinent information that shall include a meeting with the complainant and the accused Student. The Dean of Students may also meet with other concerned parties. The Dean of Students shall proceed in one of the following manners depending on the nature of the violation:
a. For offenses where the greatest sanction possible is a double warning (as defined in Section 2 below), the Dean of Students shall issue any appropriate sanction no later than seven (7) days after receiving the initial written complaint.
b. For offenses where a sanction may include a suspension or expulsion, the Dean of Students, in consultation with the Vice President for Student Development and Enrollment Management (the “VPSDEM”), shall form an Ad Hoc Disciplinary Committee to investigate the complaint, make a determination and issue any appropriate sanction. The Ad Hoc Committee shall consist of the Deans of Students, a Faculty Senate Representative, and the relevant campus Counselor. The decision and issuance of the sanction shall take place no later than thirty (30) days after receiving the initial complaint.
All sanctions must be in line with the set sanctions for non-academic violations defined in Appendix A. The Dean of Students or the Ad Hoc Disciplinary Committee shall review the accused Student’s record for prior offenses. If a Student is a previous offender of a non-academic violation, the Dean of Students or Committee normally shall increase the severity of the sanction. Any suspension or expulsion requires the prior approval of the University President.
Step 3: Inform the Student. When a final decision has been reached, the Dean of Students shall promptly inform the student both orally and in writing of the decision. The student has seven (7) days from the date the student is informed in writing of the decision to appeal against the decision in accordance with Article IV, Section 5 below.
Step 4: Maintain Student records. The designated staff at the Dean of Students’ Office shall update the Student’s record. The Dean of Students’ Office shall be responsible for coordinating all follow-up actions and maintaining the central recording system of all violations and respective actions.
1.2. Academic Violations
Step 1: Report suspected misconduct. The course instructor shall notify the accused Student that the instructor has identified an academic violation. The course instructor shall promptly inform in writing the relevant department Chairperson and the Dean of Students of the violation.
Step 2: Process the complaint. All claims will be processed by the Dean of Students’ Office. The Dean of Students shall form an Ad Hoc Committee that consists of the course instructor, relevant department Chairperson, and the Dean of Students. Additionally and depending on the severity and frequency of the violation, it may also include the VSDEM, a representative from the Faculty Senate, a representative from the Student Council and the University Legal Counsel. The Committee shall gather pertinent information and meet with the accused Student and any other relevant parties prior to issuing an appropriate sanction as per the Table of Sanctions for Academic Violations listed in Appendix B, no later than fourteen days
(14) after receiving the initial complaint.
If a Student is a previous offender of an Academic violation, the Committee normally shall increase the severity of the sanction. Any suspension or expulsion requires the prior approval of the University President.
Step 3: Inform the Student. When a final decision has been reached, the Dean of Students shall promptly inform the Student both orally and in writing of the decision. The Student has seven (7) days to appeal the decision, in accordance with Article IV, Section 5 below.
Step 4: Maintain Student records. The designated staff at the Dean of Students’ Office shall update the Student’s record. The Dean of Students’ Office shall be responsible for coordinating all follow-up actions and maintaining the central recording system of all violations and respective actions.
2. Sanctions
Sanctions may be imposed upon any Student who engages in misconduct in violation of the Student Code of Conduct. Sanction determination shall be based on the severity of the offense and the record of the accused Student. Multiple violations of this Code normally shall increase the severity of sanctions applied. Counseling may be recommended with any of the below sanctions.
All sanctions are administered by the Dean of Students’ Office, as per the provisions of this Student Code of Conduct. Following is a full and complete list of sanctions:
a. Verbal Reprimand
b. Citation: Written notice that specific inappropriate conduct is unacceptable. Two
citations will immediately translate into a warning.
c. Warning: An official written censure containing three components: a reprimand for inappropriate behavior, notice that the conduct associated with the violation must stop immediately and permanently, and notice that additional violations shall result in more severe sanctions. A warning may be supplemented with the loss of certain privileges such as denied access to any University Premises, denied participation in a University event, or denied participation in the Student Council elections. Students who have received a warning may not run for the Student Council. In the case of certain academic violations the Student may receive a Zero or an F on the
exam, assignment, or course in which the violation has taken place in addition to a warning.
d. Double Warning: An official written censure containing, in addition to the three components of (c) above, an immediate suspension of benefits of Financial Aid. A third warning leads to immediate suspension for one regular semester. A double warning may be supplemented with the loss of certain privileges such as denied access to University Premises, denied participation in a University event, or denied
participation in the Student Council elections. Students who have received a double warning may not run for the Student Council.
e. Disciplinary Suspension: Separation of the Student from the University for a definite period of time, after which the Student is eligible to return, after completing the conditions for readmission, if any. During the suspension period, the Student under suspension shall forfeit all rights of his/her Student status and access to
University Premises may be revoked. The minimum period of suspension shall be one (1) term and the maximum period of suspension shall be one (1) academic year.
f. Expulsion: Permanent separation of the Student from the University. An expelled
Student shall have no access to University Premises and shall forfeit all rights of his/her Student status immediately and permanently upon expulsion.
A Student who fails to abide by the sanctions imposed normally shall become subject to more severe sanctions.
3. Disciplinary Record/Files
Because of a potential risk to the reputation and rights of the Student suspected of misconduct, great care must be taken in handling the claim and preserving confidentiality. This obligation of confidentiality applies to all participants in an investigation, including committee members, witnesses and administrators.
4. Interim Suspension
In certain circumstances, the Dean of Students may impose an interim suspension prior to the investigation for a period that ends with the submission of the investigation report to the appropriate committee. The Dean of Students shall notify the VPSDEM of this decision. Interim suspension may be imposed for one or more of the following reasons:
1. To ensure the safety and well-being of members of the University community or preservation of University property;
2. To ensure the Student’s own safety and well-being; or
3. To ensure the normal operation of the University if the Student is disruptive.
During the interim suspension, Students shall be denied access to the University Premises (including classes) and/or all other University activities or privileges for which the Student might otherwise be eligible; she/he may also be denied access to the Residence Halls.
Students placed on interim suspension are entitled to an investigation, as outlined within this Student Code of Conduct, by the Dean of Students and the VPSDEM. If an accused Student is placed on interim suspension and later found innocent of the violation of this Code of which he or she was accused, the Student must be permitted to submit any coursework and sit for all examinations missed during the time of his or her suspension; additionally, any classroom time missed by the Student due to an interim suspension shall not be reflected in a decrease of any participation credit for the classes missed.
5. Appeals and Grievances
The University recognizes the Student’s right to appeal. Any Student dissatisfied with a given sanction may appeal the decision by following the below procedure.
Step 1: The Student submits a letter petition to the University Student Affairs Council through the Dean of Students’ Office.
Step 2: The University Student Affairs Council forms a subcommittee (the Appeals Committee) to study the appeal. The Appeals Committee is formed of the VPSDEM, Dean of Students of the relevant campus, Chairperson of the Department to which the student belongs, a Faculty Senate Representative (other than the one who served on the Ad hoc Committee), and a Student Council Representative.
Step 3: The Appeals Committee will study and discuss the appeal. The Appeals Committee may meet the accused Student or other concerned parties if more information is necessary. The Appeals Committee, through consultation with the President of LAU, shall issue a final, written decision no later than thirty (30) days after the submission of the petition. Once the decision is ratified by the President, it is final and irrevocable and does not fall under the jurisdiction of any other committee within the University.
Step 4: The Dean of Students shall inform the Student both orally and in writing of the final decision, and shall provide the Student with a copy of the appeal decision.
Article V: Glossary
1. Ad Hoc Disciplinary Committee: A temporary committee formed by the Dean of Students, in consultation with the Vice President for Student Development and Enrollment Management (the “VPSDEM”), to address a specific case of violation.
2. Appeals Committee: A temporary committee formed by the University Student Affairs Council to address a specific appeal.
3. Computer Facility: Any place within the University where one or more computers or one or more computer hookups are available.
4. Faculty Member: Any person hired by the University to conduct classroom activities or research.
5. Member of the University Community: Any person who is a Student, faculty member, University officer, staff, or any other person employed or appointed by the University
6. Sanction: A penalty for the violation of the Student Code of Conduct.
7. Student: All persons enrolled/registered and taking courses at the University on a full- or part-time basis, including but not limited to those attending the Continuing Education Program.
8. University: The Lebanese American University.
9. University Official: Any person employed or appointed by the University, performing assigned administrative or professional responsibilities.
10. University Premises: Any campus or center of the University, the LAU Medical Center – Rizk Hospital, the LAU New York Academic Center, any University-affiliated facility and all land, buildings, facilities, and other property in the possession of or owned, used, or controlled by the University.
11. University Sponsored Function: An event, meeting, reception, function or other gathering that is organized or sponsored by the University or any of its affiliates wherever occurring,
including without limitation to organized trips and study programs.
The foregoing Student Code of Conduct of the Lebanese American University was amended by the Board of Trustees on September 8 & 9, 2016 and is effective as of September 9, 2016. This Student Code of Conduct was previously amended by the Board of Trustees on March 27 & 28, 2008.
Appendix A
Non-Academic Violations Table of Sanctions
The following table defines the sanction(s) associated with each violation. In some cases and when the violation is too general, a range of sanctions is set for the pertinent committee to choose from depending on the specifics of each case.
Appendix B
Academic Violations Table of Sanctions
The following table defines the sanction(s) associated with each violation. In some cases and when the violation is too general, a range of sanctions is set for the pertinent committee to choose from depending on the specifics of each case. As for the second offense, the set sanctions apply regardless whether the violation has taken place in the same course or a different one, within the same semester or not.